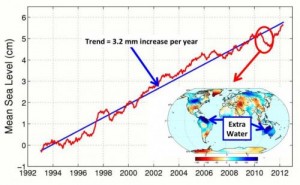
 Check out this chart (from phys.org)…while at first glance it shows the rise in ocean levels over the past twenty years, more importantly, it shows how when it comes to climate, you need to look at multi-year trends, not what’s happening in one particular year. This chart shows that ocean levels actually decreased in 2010-2011, and if you only looked at that fact, you might think that there’s no cause for alarm. However, look at the longer trend and you’ll see a very different story.
Oh, as for WHY the ocean levels dropped…that period coincided with a strong La Niña effect which temporarily shifted more than normal water from the ocean to the continents (via rainfall), a short-term effect that was canceled out once that water finished making its way back to the oceans.
